From August 2023 the comments on statistics, a short description of selected, recently issued statistical data in the area of monetary statistics and the non-residents sector statistics, are no longer published. They are replaced by Statistical releases.
Comments on monetary developments for April 2022
Although total liquid assets (M4) and money (M1) increased in April, on an annual level their growth continued to slow down.
Total placements of monetary institutions to non-financial corporations continued their strong growth started in February, while placements to other sectors (excluding the government) increased slightly.
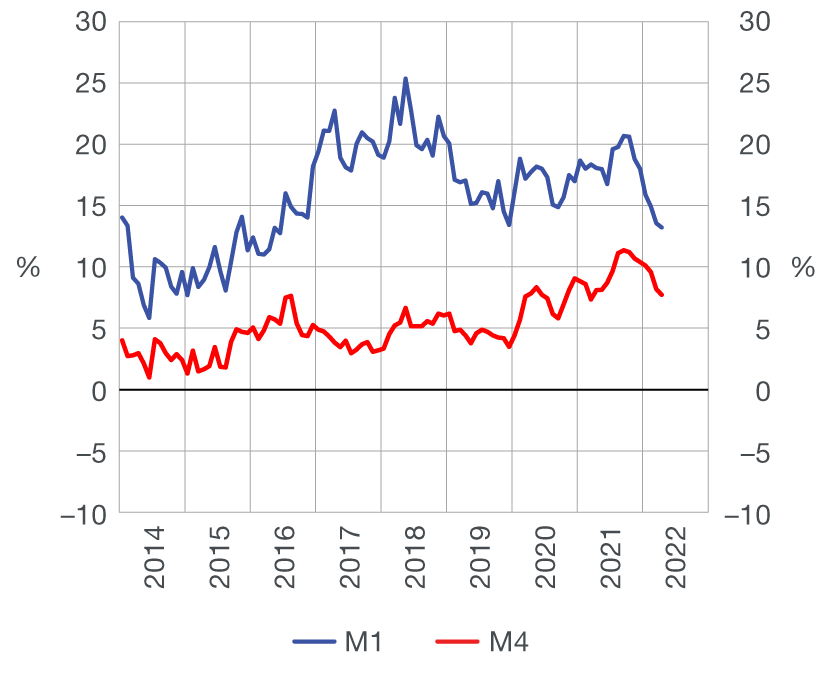
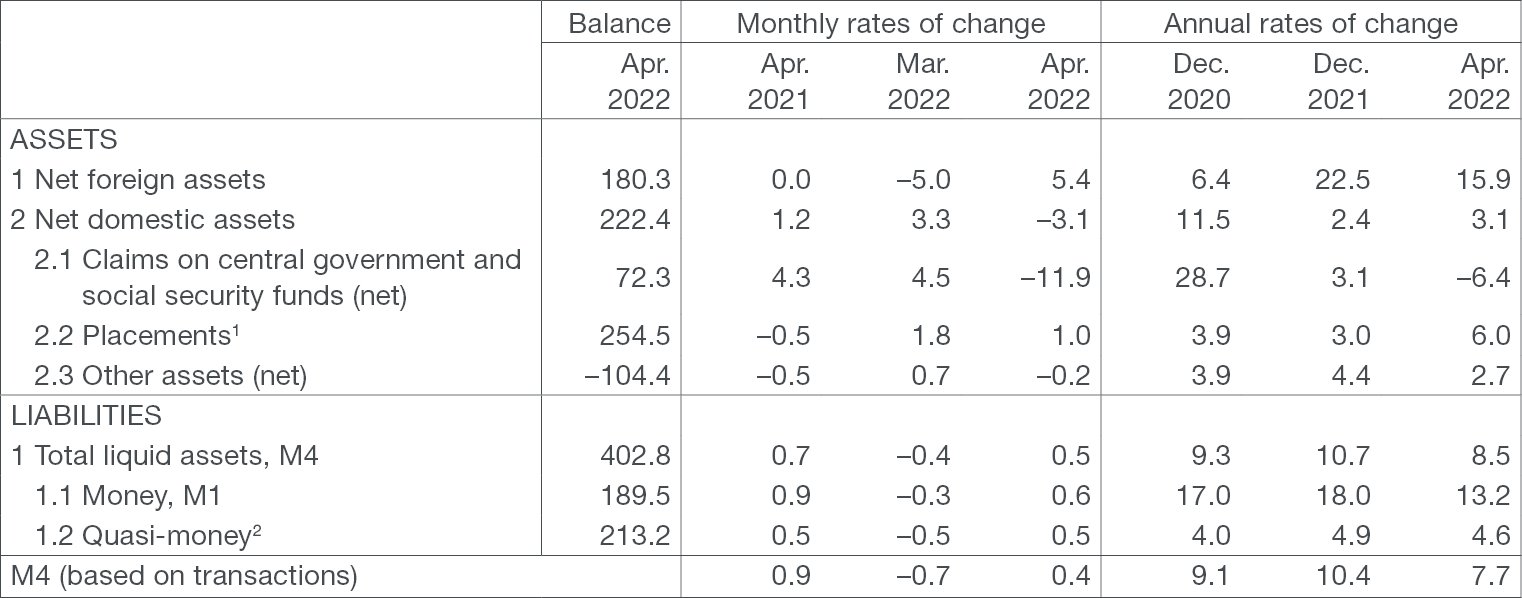
Total liquid assets (M4[1]) increased by HRK 1.7bn in April (or 0.4% based on transactions, Table 1). While net foreign assets of the monetary system increased strongly (HRK 8.2bn), net domestic assets declined by only slightly less, both predominantly as a result of the inflow of funds from the eurobond issue to the government’s foreign exchange account with the CNB. Money (M1[2]) increased by HRK 1.2bn on a monthly level (0.6%), reflecting primarily the rise in deposit money of households (Table 3). Quasi-money grew as well (HRK 0.5bn or 0.2%), which is to be attributed to higher corporate foreign exchange deposits. The annual growth of monetary aggregates continued to slow down, with M4 continuing to boast relatively high growth rates (7.7% in April) and M1 slowing down at a stronger rate (13.2%), due to the already high levels attained (Figure 1).
| Figure 1 Monetary aggregates annual rates of change based on transactions |
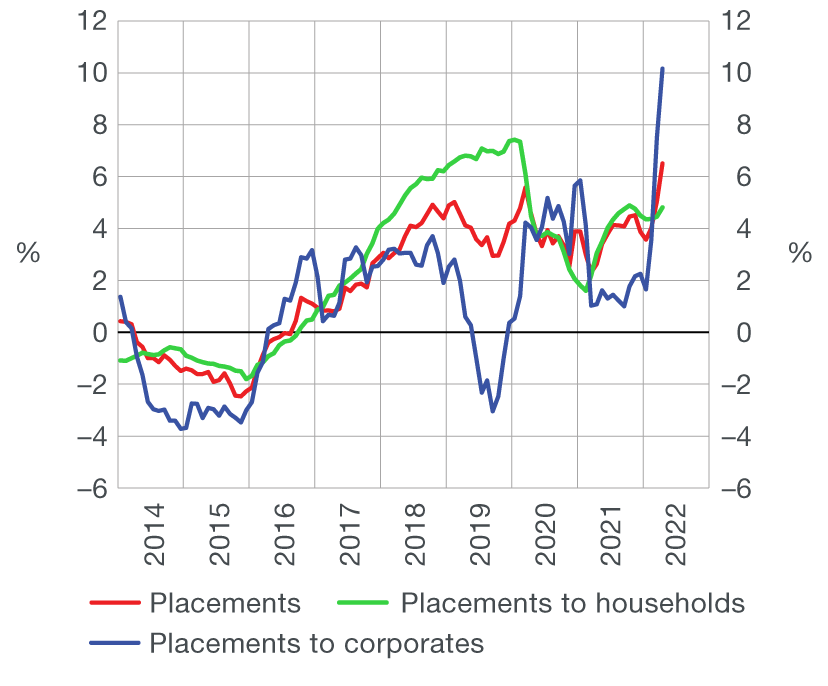
Figure 2 Placements annual rates of change based on transactions |
 |
 |
| Source: CNB. |
Total placements of monetary institutions to domestic sectors (excluding the central government) increased by HRK 2.7bn in April (1.1%, transaction-based), totalling HRK 254.5bn at the end of the month. The increase was fully accounted for by loans which make up the main component of placements, with loans to non-financial corporations rising strongly for the third month in a row (HRK 1.9bn). Corporate demand for loans most likely increased owing to sharper increase in the price of imported energy and raw materials, which increased the cost of their procurement, as well as corporate attempts to borrow at favourable conditions and thus forestall the expected increase in borrowing costs. Namely, the tension and heightened insecurity in the markets caused by the Russian aggression against Ukraine are predominantly reflected in higher inflationary pressures, especially in the segment of energy and raw materials, thus increasing the risks of a faster and stronger change in the direction of the monetary policy and growth in market interest rates. As for lending to other sectors, loans to households (HRK 0.6bn) and loans to other domestic sectors (HRK 0.2bn) (Table 2) increased slightly. Housing and general-purpose cash loans to households increased at a similar rate (HRK HRK 0.2bn), with the growth rate of housing loans edging up on an annual level (from 8.0% to 8.1%) and the growth of general-purpose cash loans remaining unchanged (3.4%). The annual growth of total placements additionally accelerated (from 5.0% to 6.5%) as a reflection of the mentioned considerable acceleration in the growth of placements (from 7.5% to 10.2% on an annual level).
Table 1 Summary consolidated balance sheet of monetary institutions
in billion HRK and %
1The sum total of asset items 2.2 to 2.8 of Bulletin Table B1: Consolidated balance sheet of monetary financial institutions.
2The sum total of liability items 2 to 5 of Bulletin Table B1: Consolidated balance sheet of monetary financial institutions.
Source: CNB.
Table 2 Loans (except the central government) and main components
in billion HRK and %
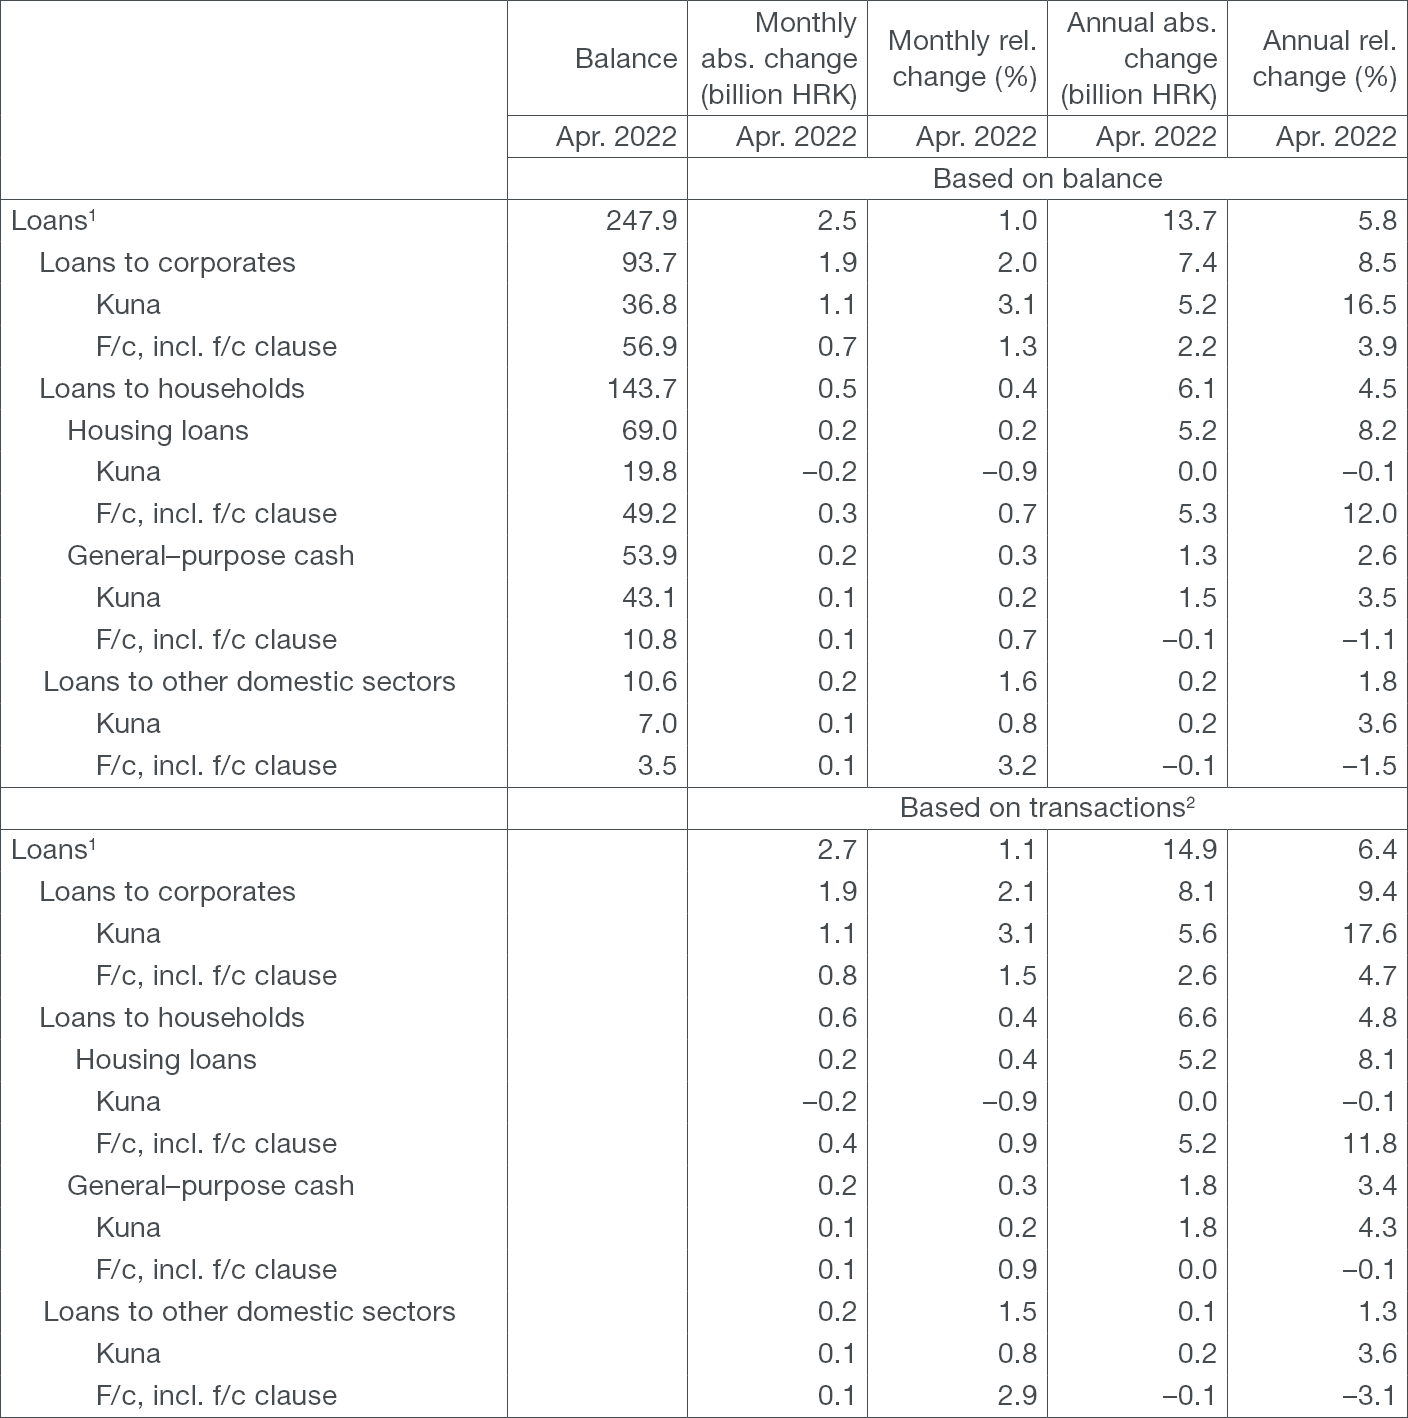
1 In addition to loans to households and corporates, they also include loans to the local government and other financial institutions.
2 The transactions show changes that exclude the effects of exchange rate changes, securities price adjustments, reclassification and write-off of placements, including the sale of loans in the amount of their value adjustment.
Source: CNB.
Table 3 Deposits (except the central government) and main components
in billion HRK and %
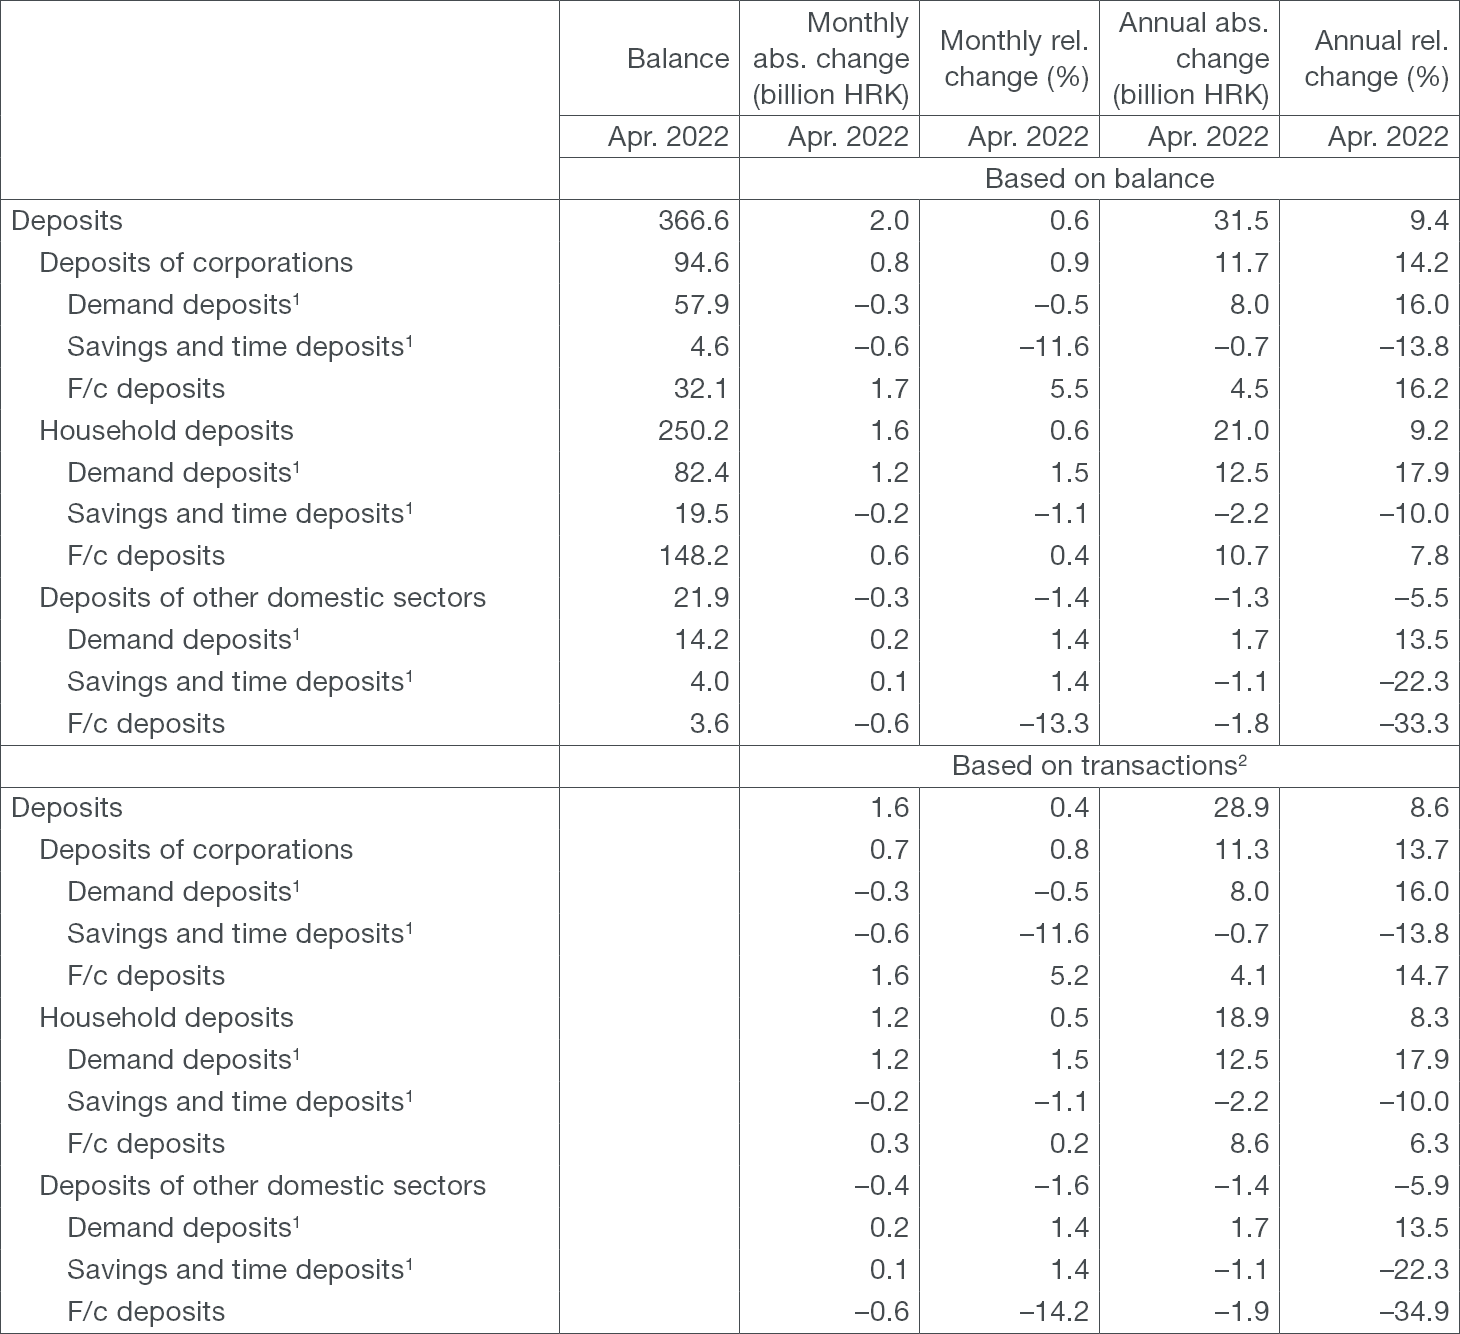
1 Includes only kuna sources of funds of credit institutions.
2 The transactions show changes that exclude the effects of exchange rate changes, securities price adjustments, reclassification and write-off of placements, including the sale of loans in the amount of their value adjustment.
Source: CNB.
For detailed information on monetary statistics as at April 2022, see:
Central bank (CNB)
Other monetary financial institutions
